Is it possible to eat a soup with a fork? Yes, it is. However, it would be very inefficient, and I am sure you are not doing this at home. But what would you do at the canteen at work when you realize everyone around you is using a fork to eat the soup? Your manager is asking you to do so; this is what is written in the formal “Soup eating guidelines,” and even external auditors are requiring it. Would you still reach for a spoon? 😉
What does this have to do with the Gage R&R procedure (one component of the Measurement System Analysis, or MSA) in the title of this article?
Well, I dare to say that in around 80% of the cases when someone is trying to confirm that the measurement equipment used in the manufacturing environment is precise and consistent, unnecessary procedures are being used – procedures that take time but do not deliver a relevant outcome…
Let me explain:
Two main applications of Measurement System Analysis
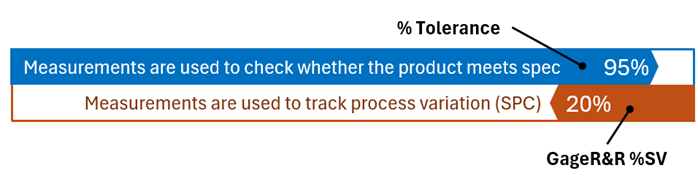
There are two main reasons we perform measurements in the manufacturing environment:
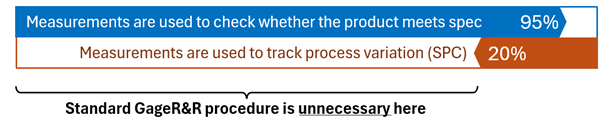
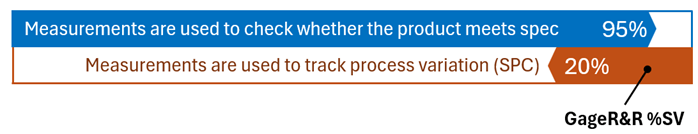
- First, valid in approximately 95% of cases, is to check whether the product meets the specifications.
- Second, valid only in about 20% of cases, is to track process variation over time, for example, in the statistical process control (SPC) applications.
There are two separate indicators to check the applicability of our measurement system for those two purposes:
- %Tolerance for the first,
- GageR&R %SV for the second.
For mysterious reasons, many organizations (and customers, and auditors) keep using the second indicator (with a complex and time-consuming standard GageR&R procedure behind it), even in cases where they should not use it…
Feels like eating a soup with a fork…
To support my point, let’s dig into the fundamentals of the precision component of MSA:
Example
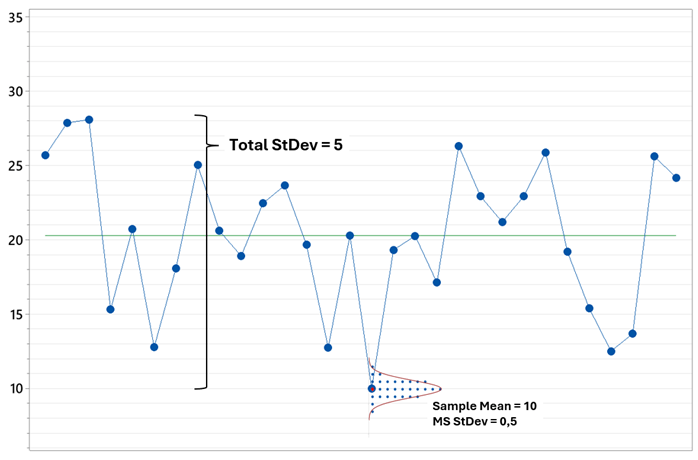
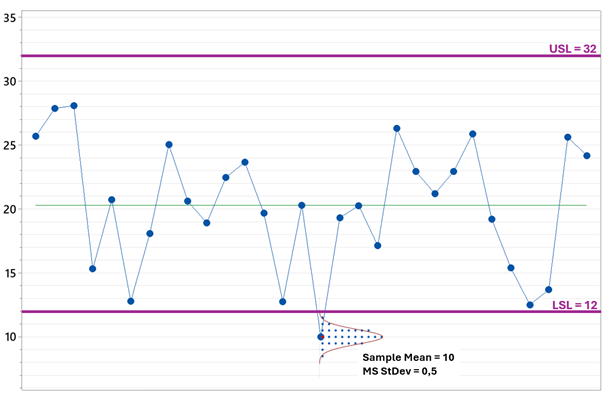
Let’s imagine that this is our manufacturing process, sampled and measured by our measurement equipment. Let’s say all results are in grams.
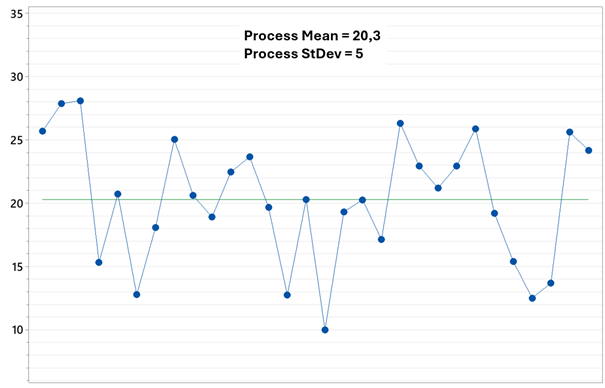
Let’s take one sample (for example the one with value 10) and measure it several times, in different conditions that may happen during the measurements (different operators, different lighting conditions, different fixtures – whatever can influence the result)
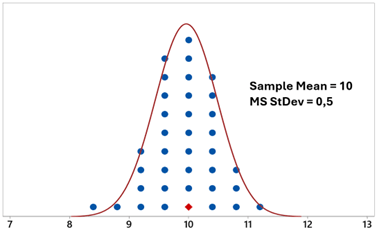
Variation (or lack of consistency, or precision, you name it) observed here is the overall Measurement System (MS) variation, here on the level of StDev = 0,5g
Is it a big or a small value? Acceptable or not? Is our measurement system good enough in terms of precision, or not really?
To answer this question, we need to provide some perspective and compare this variability with something else.
First option: let’s compare the MS variation with the process variation.
The metric commonly used here is GageR&R%SV, calculated as a simple ratio between two standard deviations: the one connected with MS variation only, and the total observed variation of the process.
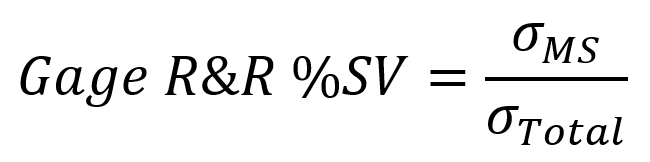
Such a ratio will tell us whether the MS variation is small compared to the process variation. Are we able to differentiate one product sample from another?
In the example above, this ratio is 10%, which is commonly considered a small and acceptable value.
We should interpret it as: the precision of our measurement system is good enough to track process changes over time, for example, as part of Statistical Process Control procedures.
How to get GageR&R %SV value in practice?
There are several options, but the most common is the standard GageR&R procedure, which is about:
- Selecting from the process several samples that cover its typical variation range
- Measuring them several times in different measuring conditions (e.g., with different operators)
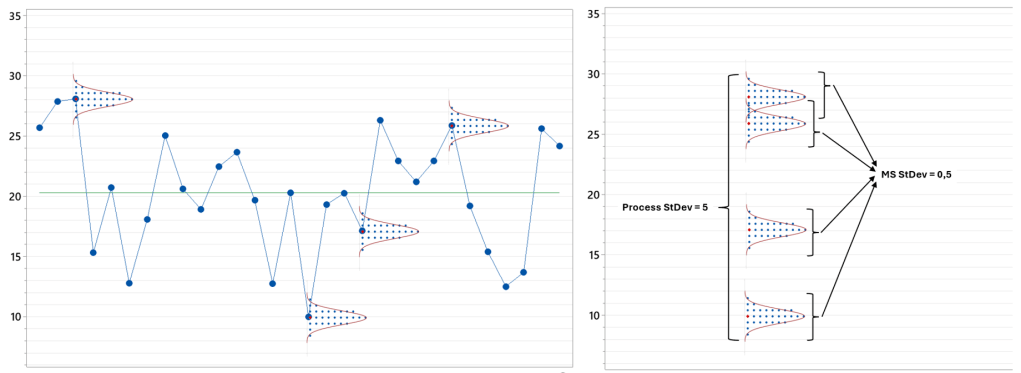
After this, we can estimate Total StDev from the differences between samples, estimate MS StDev from the variation within samples, and calculate GageR&R %SV indicator for our Measurement System.
Second option: let’s compare the MS variation with the specification.
The metric commonly used here is %Tolerance, calculated as a ratio between 6 standard deviations of the measurement system and the width of the product specification:
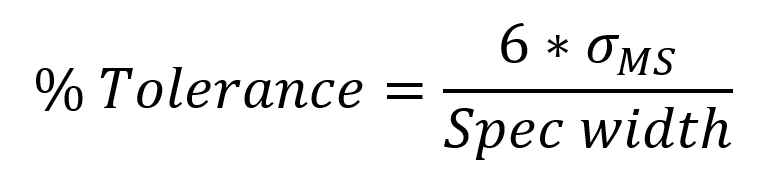
Such a ratio will tell us whether the MS variation is small comparing to the product specification. Can we reliably tell if the product is within the spec or out of spec?
In the example above, this ratio is 15%, which is not perfect, but still a small and acceptable value.
We should interpret it as: the precision of our measurement system is good enough to check whether the product meets the specification, for example, during product quality control procedures.
How to get %Tolerance value in practice?
Very easily, in most cases, we just need to:
- Select one arbitrary sample from the process
- Measure it several times in different measuring conditions (e.g., with different operators)
After estimating MS StDev from the measurements and comparing it with the specification width, we will get the % Tolerance indicator.
And here we are coming back to the opening question:
Why are we using the “fork” of GageR&R%SV if all we need to check if our measurement system is good enough for quality control is the “spoon” of %Tolerance metric?
Another example
Let’s see how the situation will look for the same measurement system and specification, but this time with a very consistent, stable manufacturing process.
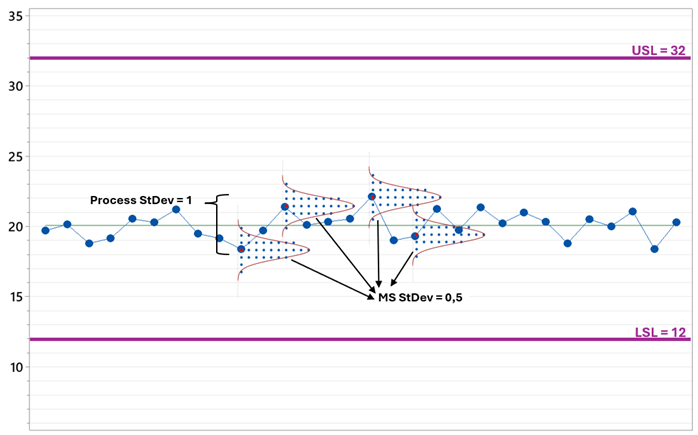
GageR&R %SV in this case would be 50%. Far above the marginally acceptable level of 30%. Our measurement system cannot track process changes here, because process variation is comparable to the measurement system variation (and we will never know if we are tracking real process changes or just measurement system variation)
But the %Tolerance metric is still 15% (the same MS StDev, the same spec) – the measurement system can still be very effectively used for the quality control procedures.
The question is: what is the purpose of the measurement system in our case?
If it is used for quality control procedures, to check whether the product meets the spec (as I estimate happens in 95% of cases), we should not use the GageR&R %SV metric to judge it.
If we insist to do so, we will be frustrated (“Why this does not work, even if I have very precise measurement system, a few ranges below the spec?!”) and/or trying to do strange things (“Let’s try hard to find/prepare really extreme product samples, what would inflate Total StDev and bring GageR&R %SV down”).
Instead of using the proper % Tolerance metric in this case, together with a simpler and faster procedure to get it…
Exactly like eating a soup with a fork instead of a spoon….

Leave a comment