I recently had some discussions about SPC (statistical process control) that reminded me how easy it is to get lost in the topic, even after years of using it…
Let me try to sort things out, staying on the general but practical ground and focusing on the purpose, not “mathematical mechanics.”
Application
But first, let me point out that process stability and capability concepts apply to any process that we care about, no matter if it is the automotive industry or the food industry, no matter if this is a “technical” process on the shop floor or a “business” process in the office.
The are only three prerequisites needed:
- We can quantify the output of the process (dimension of the part, property of the product, number of invoice errors, condition of the patient, time to solve the case, etc.)
- We can track those values over time (part by part, minute by minute, shift by shift, month by month, etc.)
- There is some target/requirement for what the values are expected to be (“Values within those limits are acceptable, values beyond are not”)
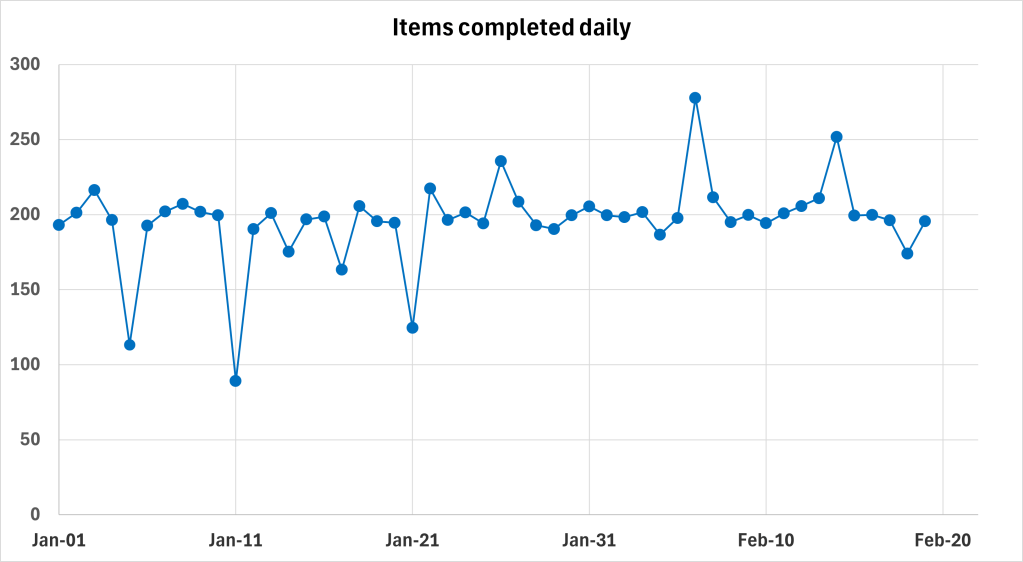
Let’s take the picture below as an example of the output from the process we would like to statistically control, with the number of items completed on any given day as the parameter we would like to track:
Purpose
Secondly, let’s be clear about the purpose and benefits of process stability and capability studies. Why should we bother?
- Process Stability is about predictability. These are concepts, tools, and steps to be applied to avoid chaotic, unpredictable process behaviour that can cause unexpected business problems (“We don’t know what to expect next time!”) – and turn it into a predictable process that we can rely on (“Next results would be very likely somewhere in this range”).
- Process Capability is about alignment with requirements. “Are we delivering results within the agreed limits? How well within?”
I will focus on the Process Stability in this article, leaving Process Capability for the second part.
Fundamental ideas behind Process Stability Study
To get full benefits from the Process Stability concept, it is important to comprehend a few key ideas first:
- Every process has variation. Variation can be big or small (sometimes so small that it is unmeasurable or invisible), but there is always some.
- There are two major types of variation:
- Common-cause variation (or “natural variation”)
Variation that is “inherited” to the process. Something that is always there, caused by “natural phenomena” within the process; all those small bits and pieces that make two consecutive parts from the same manufacturing line, two apples from the same apple tree, or even two replicates of DNA – never identical. - Special-cause variation
Variation that is “external” to the process. Something that “poked” the process from the outside and moved it away from its ‘natural’ state.
- Common-cause variation (or “natural variation”)
Now, what does “predictable process” mean in this context?
It is not about limiting process variation to zero (because every process has variation!), but about ensuring that only natural variation exists.
If there is only natural, common-cause variation in the process, then we can measure it (for example, by estimating standard deviation connected with it) and reliably use statements like “We are 95% sure that the next result would be somewhere in the range of two standard deviations from the average.”
Such a process, with only common cause variation, is formally called a statistically stable process.
On the contrary, when special causes dominate process variability, we cannot say too much about the process’s future. Some external factors influence the process significantly and move it in unpredictable directions.
Now, we can translate the high-level goal of a process stability study (obtaining a “predictable” process) into a more technical term: obtaining a statistically stable process.
But how to do it? Step by step 😊
Step 1: Detect special causes
If special causes stop us from getting statistically stable process, let’s make sure we can identify them. Preferably in some automatic way, that would work equally well for all types of processes, no matter what they are delivering, how they are working in detail and how frequently they are measured.
Is there such a way available? Definitely! Thanks to Walter A. Shewhart, since May 1924, we can use Control Charts to detect special causes and separate them from common-cause variation of the process.
This how it would look like for our example process:
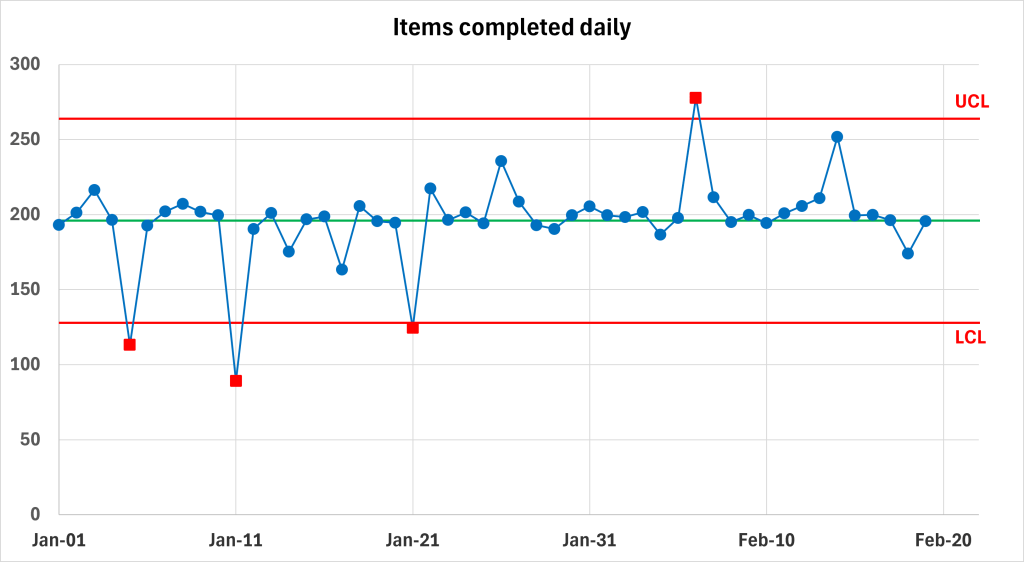
How does it work? Source data (process output values collected over time) are analysed using commonly agreed calculations (let’s keep the details out of scope of this article), and two control limits are established automatically: Upper Control Limit (UCL) and Lower Control Limit (LCL)
Variation that we can observe within those limits is most likely common-cause variation (with some exceptions that will also be kept outside of this article).
Variation that we can observe outside of those limits is most likely caused by special causes, and relevant points are automatically marked in red.
We can now rephrase our goal once more: to get a predictable process, which means a statistically stable process, we “just” need to ensure that there are no red points on the control chart (oversimplifying the story only a little bit…)
Step 2: Understand reasons behind special causes
Of course, we cannot just remove the red points from the graph (in fact, we can; however, it will not improve the underlying process at all 😊). The only way to limit the number of special causes is to understand what is causing them and then try to prevent them from happening again.
The definition of special causes is helping us here: they are triggered by “something that poked the process from the outside,” so there is very likely tangible “something” to be potentially spotted and identified: forgotten screw, sudden contamination, a drop of pressure, very unusual order, etc.
Of course, it is not always easy, especially in complex processes with many factors influencing the process from different angles. However, two strategies can significantly increase the chance of spotting the reasons behind special causes:
- Plotting process output on the control chart in the real-time and at the location where the process is executed (so-called “Online SPC”). Thanks to this, if a special cause is detected, the item that has been measured out of control limits is in front of our hands and eyes – and we can note down what is exceptional/unusual/interesting about it (potential root cause)
- Collecting extensive amount of information and comments about the process, including measurements of different process factors, also external, and descriptive comments about anything unusual spotted in the process. Thanks to this, when plotting the data on the control chart later, we can try to correlate special causes with some other factors and comments (potential root causes)
Step 3: Prevent special causes from happening again
No matter how we will get to the reasons behind special causes – the next step is to install proper “fences” around the process to avoid future “poking” from external factors. We are talking here about various methods, sometimes very specific to the technicalities of the process under study. But in general, this is often about controlling external conditions of the process (ambient temperature, pressure, etc.), monitoring inputs to the process (e.g. properties of raw materials, to reject those beyond acceptable limits), or installing mistake proofing mechanisms (so-called Poka-yoke) to limit or prevent human errors.
Outcome
When all those three steps are practiced continuously and periodically, the number of special causes in the process decreases, control charts become “less red”, and the process becomes statistically stable and, as a result, predictable.
Summary
Let me add small disclaimer at the end. Control Charts do help us detect special causes, and they are indeed very effective here. But this detection is not “set in stone.” It is not “guaranteed” that every point detected by the Control Chart as a special cause was truly caused by an assignable factor external to the process. But we can be sure that it is worth (from business point of view) to treat them that way. There is a high chance that such an external factor will be found, and, when actioned properly, we will get the process one step further towards process stability and predictability.
On the contrary, trying to find assignable, external factors behind the points marked as common causes will most likely lead to spending plenty of time and finding nothing…
In other words: Control Charts are not always right, but it is crucial to use them and follow their recommendations!
Happy control charting and good luck in making your processes more predictable!
PS. If you would like to play with the example data, here is the file:


Leave a comment