All major process improvement methodologies (like Lean or Six Sigma) offer specific tools and methods to improve any given process: “remove non-value-added activities”, “reduce variation”, “find the optimum setting of the key input, to get desired output”, etc.
Those methods and tools work very well, however only with the assumption that people using them know the process they are trying to improve.
Lean, usually applied to simpler processes, does not really have this problem at all. It is very often obvious what to do to improve the process.
Six Sigma, practiced in more complex cases, deals with it by recommending process experts to be part of the improvement team, focusing on process mapping, experimentation, statistical analysis, etc.
But at the end, if the process knowledge is fundamentally missing in the team, all process improvements would be dangerously close to random changes to the process…
So, if process knowledge is crucial for Process Excellence, how do we know that we have it in the organization? Can we somehow check “how much” knowledge we have? What are methods to gather, store, and increase it?
In this article, I will share my approach to the topic.
The Scene
Although the concept is equally applicable to any process delivering output (regardless of whether it is a product or service), let me limit the discussion to the environment of manufacturing goods in non-trivial manufacturing processes.
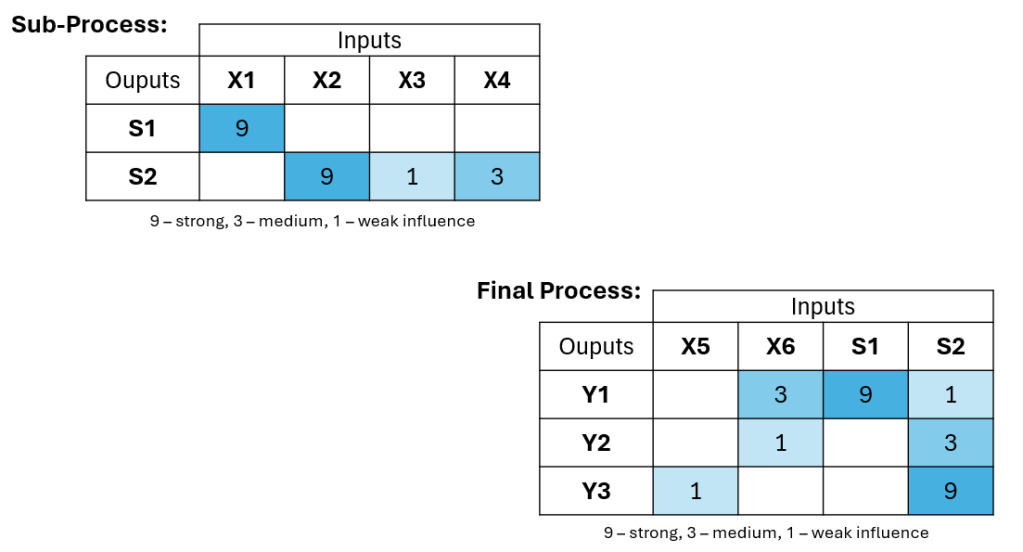
Let’s take the following process as an example. Our final product (let’s say a pen) has three properties that are important for the business (let’s say: Y1 – ink colour, Y2 – trace width, and Y3 – writing time). There are two processes needed to make the final product (sub-process to prepare the ink and final process to fill the pen with the ink), and there are several factors (or Xs) that are influencing those processes (let’s say: properties of raw materials, process parameters like mixing time or pump speed, ambient conditions like temperature and humidity, etc.)

The Perfect World
What would complete knowledge look like in this scene? I would say: we know all factors influencing the process, and we know how they influence the final product properties, both qualitatively and quantitatively. As a result, if we spot, for example, that raw material moisture is 2% higher than optimum, we will know that we need to extend the drying time by 7 minutes to get back to the optimum ink color. There would be no need for final product quality control because we would know the product properties just by monitoring all relevant factors…
The Reality
Is such perfect knowledge achievable? Not at all. But every step in this direction allows for more effective process improvements and better business results.
What are those steps? Here is my proposal:
- Identify all potential factors in the process and all product (and sub-product) properties. Note them down clearly.
- Make sure you can reliably measure all of them
- Identify (and note down) qualitative relations between factors and output properties
- Define quantitative relationships between them (build a mathematical model of the process)
- Implement relevant control mechanisms for all factors to ensure the output is of good quality.
Some may say that this is just about the science: if we have enough fundamental knowledge about reality inside our process (thanks to physics, chemistry, thermodynamics, etc.) – we are all set; we know everything. Unfortunately, this is not the case. Fundamental knowledge is indeed a key. But it would not be enough in our manufacturing/engineering environment: our specific process has specific, not ideal equipment. With irregularities, not perfect surfaces, impurities. We need to get knowledge about our process, not theoretical mechanism.
Others may say that this is in fact DMAIC. To some extent, it is true. However, we are not talking here about a single, specific improvement effort (“improve ink quality by…”) but about an organizational-wide approach that should start in the early R&D phases of new product development and continue over the whole lifecycle of the product’s manufacturing.
Tools that help
If not (only) the science and not (really) the DMAIC – what are the tools and methods that can help us follow the steps above? Here are some recommendations from my side:
I have found House of Quality very useful for steps #1 and #3. However, I would simplify the tool and make sure it is applicable not only for designing new products (as in original Quality Function Deployment concept) but also when producing them, in multi-step manufacturing processes. For example, in the form as below, where we can clearly see what factors influence specific output properties, which should be controlled the most, which should be analysed first in case of customer complaint about the property Y2, etc.
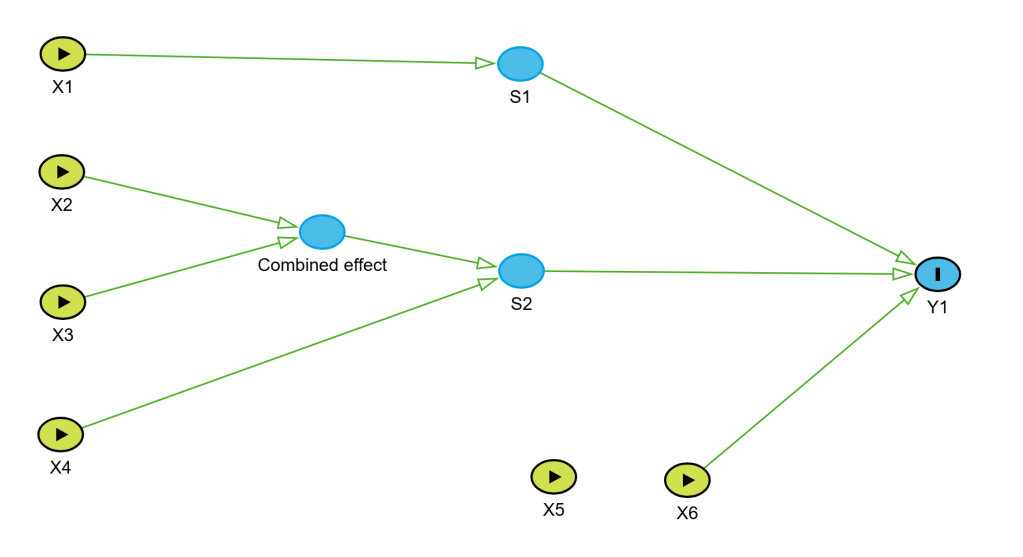
If we would like to get deeper into step #3, I would see Causal Diagrams as a great tool to use. This is quite a rare approach in the context discussed here, but it brings great value. First, to clearly document cause and effect relations happening in the process (just suspected or already confirmed), discuss them among process experts, challenge their opinions, and improve the common understanding. Secondly, as input to the upcoming data analysis, to avoid problems with mixing correlation and causation effects in the data.
Causal Diagrams can be done “on the piece of paper”, just as brainstorming or “thinking tool”, but we can also utilize the more formal concept of directed acyclic graphs (DAG) here. As I have recently learned, DAGs have a firm role in more advanced statistical analysis. I see great value in using the same approach in both “worlds”: process technology and statistical analysis.
Let’s see how our process can be described using Causal Diagram:
Such data analysis (in all types of regressions, designed experiments, analysis of variance, etc.) is clearly coming into play in Step #4. The ultimate goal is to create a useful1 mathematical model of our process that will allow us to manage it almost perfectly.
Nowadays, more modern methods are used here (like machine/deep learning, etc.). However, I am still debating with myself: if we have a perfect model of our process that can reliably predict all our outputs, but it is in the form of a “black box” that we cannot look inside, do we really know our process? Or just unthinkingly follow black-box instructions?
No matter how we execute Step #4, it will not happen without Step #2, supported by Measurement System Analysis concepts. This is to ensure that all the data we are using are accurate and precise enough. “Enough” is a key word here: it is not about having perfect measurements – it is about knowing uncertainties within them (bias, variability, etc.) and factoring this into the analysis and decision to be made.
Step #5 is where all the knowledge we have gathered comes together to monitor and control the process. Typically, Statistical Process Control methods are used here and are very valuable for maintaining the process. I see it also as a way to keep increasing our knowledge about it: every special cause can be (should be!) a trigger to do small root cause analysis, which would keep building up our understanding of the process.
The Journey
Now that we know the goal (“The Perfect World” we aim for) and the steps to get there, we can start tracking our progress on this journey. How much have we already achieved, and how much is still to come?
We can do it by asking questions (in self-assessment mode) connected with all the steps we have discussed:
- Do we have a list of all factors and all output properties? How complete is it?
- How many of them can we reliably measure? Do we know the uncertainties behind all those measuring systems? Have them noted down somewhere?
- Do we have a matrix showing qualitative relations between your factors and outputs (for example, in the form of House of Quality or Causal Diagrams)? How complete and up-to-date is it?
- Do we have models with quantitative relations for all output properties (for example, as a result of the Design of Experiment)? Are they noted down somewhere? How complete and up-to-date are they?
- Do we monitor and control key factors? How many of them?
Answers to all those questions can be converted into percentages and aggregated to a single “Knowledge Score” number. Kind of: “How much knowledge about the process do we have now? 20% or 80%?”. Of course, not to be perfectly accurate in this judgment, but to create awareness of the knowledge gaps and desire to keep closing them.
What do you think about this approach? How do you manage process knowledge in your organization?
- As famous George Box said: “All models are wrong, some are useful“, meaning that reality would always be more complex that any formula we will develop. But we can be close enough 🙂 ↩︎


Leave a comment